Data Artist – my original passion that led me into the Data-sphere
Data Project Manager – helping teams create Data Products across multiple departments
Tableau, Power BI, Quick Sight – expertise in Data Visualization, Dashboarding and Data Storytelling
Tableau Ambassador and Tableau User Group leader – events in Munich and events for Data+Women Germany with Heidi Kalbe
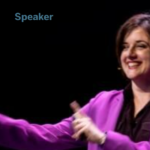
Public Speaking – I love to share my insights, experience and my passion with fellow enthusiasts!
- DIY Dataviz – a Workshop
 Workshop – Truth and Beauty Operator Moritz Stefaner and me created a Dataviz Workshop without any… Read More »DIY Dataviz – a Workshop
 - AI took my job – now I am their supervisor
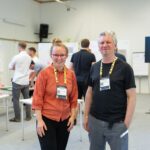
 Panel Discussion – INFORMATIK 23 Berlin I was invited on the panel about AI and job… Read More »AI took my job – now I am their supervisor
 - Power Lunch: All about Tableau
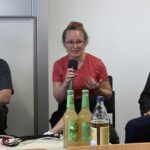
 Event – Tableau for beginners: 60 Minutes Deep Dive with Women In Tech e.V. My audience… Read More »Power Lunch: All about Tableau
 - On the History of Dashboards
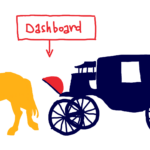 Guestauthor Felix Diefenhardt of the Wirtschaftsuniversität Wien is working on his PhD about Dashboards and their… Read More »On the History of Dashboards
 - Nightingale – journal of the Data Visualization Society
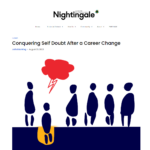 Blog – passion and effort were my secret weapons to mastering the career change from Artist… Read More »Nightingale – journal of the Data Visualization Society
 - Unf*ck your Data – Tableau community edition
 Podcast – What is special about the Tableau Community? Unf*ck your data is format that covers… Read More »Unf*ck your Data – Tableau community edition
 - VizIt Berlin Speaker Announcement
 Talk – Community in-person event in Berlin, November 13-14th Register for this free event here: VizIt… Read More »VizIt Berlin Speaker Announcement
 - TUG Muc 9th Meeting Recap
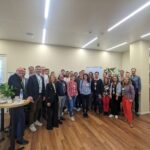
 Tableau User Group – The meeting was hosted by Airport Munich with Keynote speaker from Wilo… Read More »TUG Muc 9th Meeting Recap
 - Dynamic Zone Invisibility Florida TUG
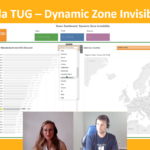 Tableau User Group – In 2022.3 a new feature stirs up the Tableau COmmunity: showing and… Read More »Dynamic Zone Invisibility Florida TUG
 - The Tableauverse: Tableau Desktop and Tableau Server
 Video – Which Tableau Products are there and how do they interact to provide one of… Read More »The Tableauverse: Tableau Desktop and Tableau Server
 - 8th TUG Munich Meeting – server logs
 event recap – Using Tableau Server Logs to track if users are using the dashboard they… Read More »8th TUG Munich Meeting – server logs
 - Dark Data Design – an example
 Blog – the discounter Lidl misuses Dataviz to make their disposable plastic bottle appear environmentally friendly.… Read More »Dark Data Design – an example
 - 02.03.23 Tableau in 100 Minutes
 Workshop – I again team up with Junge Gesellschaft für Informatik and offer a workshop and… Read More »02.03.23 Tableau in 100 Minutes
 - 25.04.23 TUG Munich 8th Meeting
 In-Person Event- The Munich Datafam meets again on Tuesday 25th of April.
 - 28.02.23 Dataviz Meetup @ Celonis
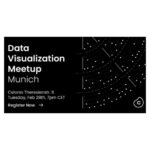 In-Person Event – 16th Dataviz Meetup Munich at Celonis Headquarter! Organized by Mihael Ankerst, Phillip Koytek… Read More »28.02.23 Dataviz Meetup @ Celonis
 - Center of Enablement: Tableau Visionary Annabelle Rincon
 Good Read – I was so pleased to welcome Annabelle Rincon to our 7th in-person Tableau… Read More »Center of Enablement: Tableau Visionary Annabelle Rincon
 - 5 Seconds Difference: Dataviz vs. Excel (GER)
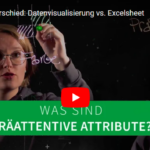 Explanatory Video – Did you know that your brain knows the meaning of this ⬆ much… Read More »5 Seconds Difference: Dataviz vs. Excel (GER)
 - Podcast Episode: There’s never a step back (GER)
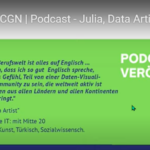 Podcast – “There’s never a step back in life, even though I studied art and work… Read More »Podcast Episode: There’s never a step back (GER)
 - How to kill your dashboards
 Good Read – I am a passionate dashboard developer – but this is a plea for… Read More »How to kill your dashboards
 - 5 Layout Tips for BI-Dashboards
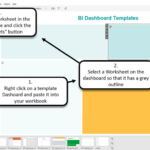 Good Read – What can modern dashboard developers learn from Michelangelo to build better dashboards? Learn… Read More »5 Layout Tips for BI-Dashboards
 - Are you interested in migrating to the new Tableau data model 2020.2? Here is a guideline
 Good Read – Connecting Data Sources through Relationships was a gamechanger for me in version 2020.2.… Read More »Are you interested in migrating to the new Tableau data model 2020.2? Here is a guideline
 - 03.02.23 TUG Munich: Tableau Center of Enablement
 In-Person Event – The Munich Datafam is coming together once more, we are hyped to have… Read More »03.02.23 TUG Munich: Tableau Center of Enablement
 - 18.02.23 Smart Information Densification: Healthcare TUG
 Remote Event – Everybody knows real estate is expensive. And I am not talking about a… Read More »18.02.23 Smart Information Densification: Healthcare TUG
 - My Dataviz-bookshelf
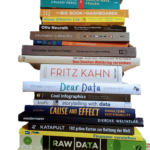 Books – When dataviz books are concerned, I admit to being an impulse buyer. And when… Read More »My Dataviz-bookshelf
 - Data+Women Germany:
 Remote Event – I have joined Heidi Kabe as a leader of Data+Women Germany. I am… Read More »Data+Women Germany:
 - Tableau User Group MunichIn-Person Event – In 2022 I started organizing events for the Munich Datafam. Together with Ahmad… Read More »Tableau User Group Munich
- 04.03.22 TUG Germany: Top 10 ChartsRemote Event – Top 10 Chart Types with a Twist! Beginner and Advanced Friendly. Back to… Read More »04.03.22 TUG Germany: Top 10 Charts
- 2022 Tableau Ambassador
 Announcement – I am beyond happy to be one of the 2022 Tableau Ambassadors! Thanks to… Read More »2022 Tableau Ambassador
 - 12.04.22 In 100 Minuten zum Tableau Dashboard
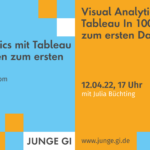 Workshop – Together with the “Junge Gesellschaft für Informatik” I organized this workshop for university students… Read More »12.04.22 In 100 Minuten zum Tableau Dashboard
 - 08.03.22 Tableau Buddy User Group: From building sculptures to building dashboards
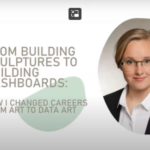 Remote Event – How did I end up in Tech, when I used to be an… Read More »08.03.22 Tableau Buddy User Group: From building sculptures to building dashboards
 - 16.12.22 Data+Women Christmas Special: From Art to Data Art
 Remote Event – Happy to share my story how I changed careers from Art to Data… Read More »16.12.22 Data+Women Christmas Special: From Art to Data Art
 - 19.07.22 Hetug: Hacks with invisible Shapes
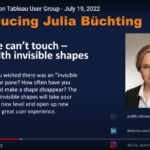 Remote Event – Everybody knows Shapes in Tableau, but did you know you can add an… Read More »19.07.22 Hetug: Hacks with invisible Shapes
 - 27.09.22 Level Up II: UX in everyday life into BI dashboards
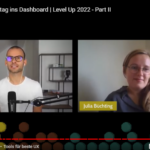 Remote Event – How can we use everyday UX in our dashboards to make them more… Read More »27.09.22 Level Up II: UX in everyday life into BI dashboards
 - 20.04.22 Austria TUG
 Remote Event –
 - BI or DIE: get to know
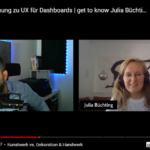 Conversation –
 - 5 Layout Tips for Business Intelligence Dashboards
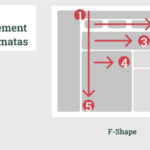 Good Read – What can we learn from Michelangelo about good layout? Do you know this… Read More »5 Layout Tips for Business Intelligence Dashboards