Blog – the discounter Lidl misuses Dataviz to make their disposable plastic bottle appear environmentally friendly.
Lidl has started a huge marketing campaign in Germany promoting their disposable plastic bottle. The campaign is not only aimed at the public, it includes a hefty lobby budget to keep the disposable bottle afloat. This comes amidst various efforts by the European parliament aswell as the German government to increase the use of reusable plastic and glass bottles.
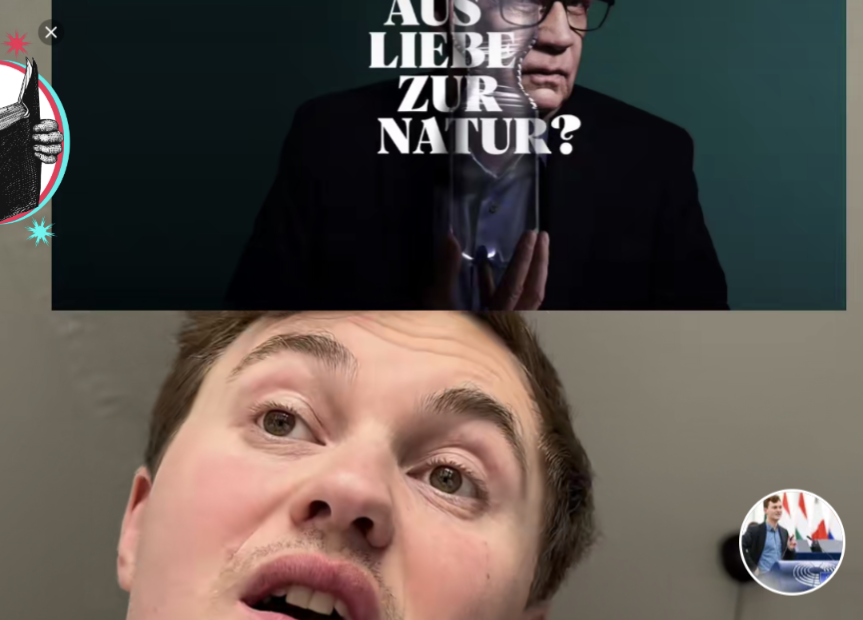
They use the famous TV host Günther Jauch as their public spokesperson.
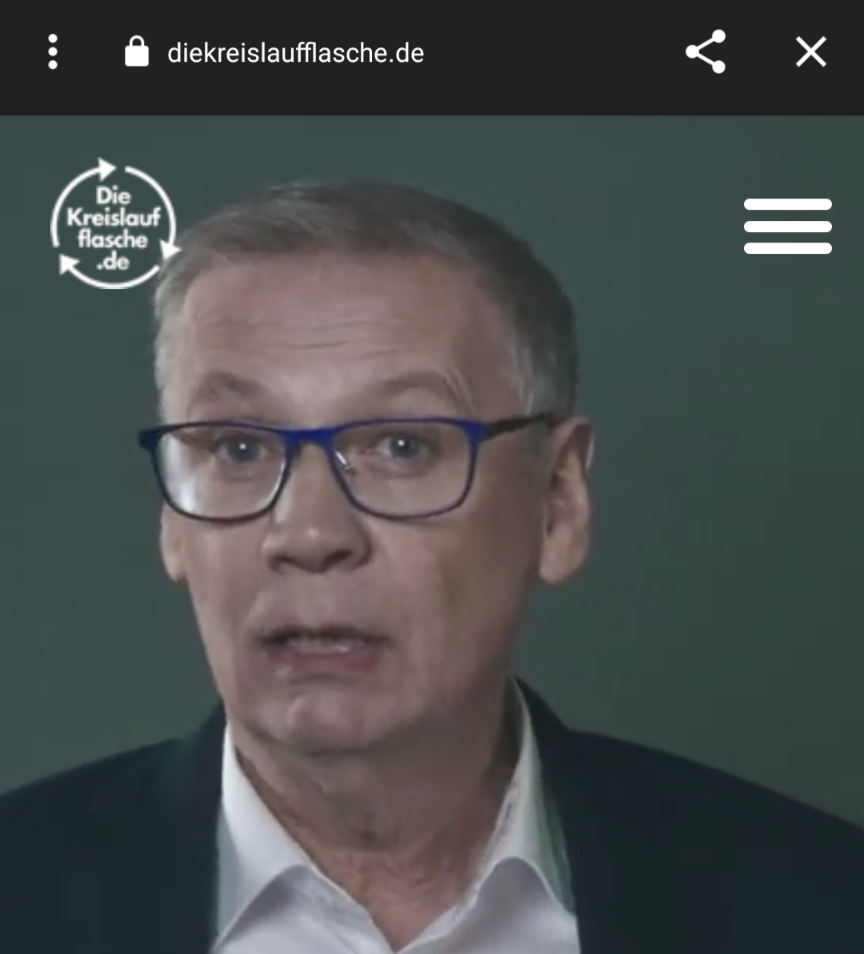
On their website www.kreislaufflasche.de they show this Dataviz:
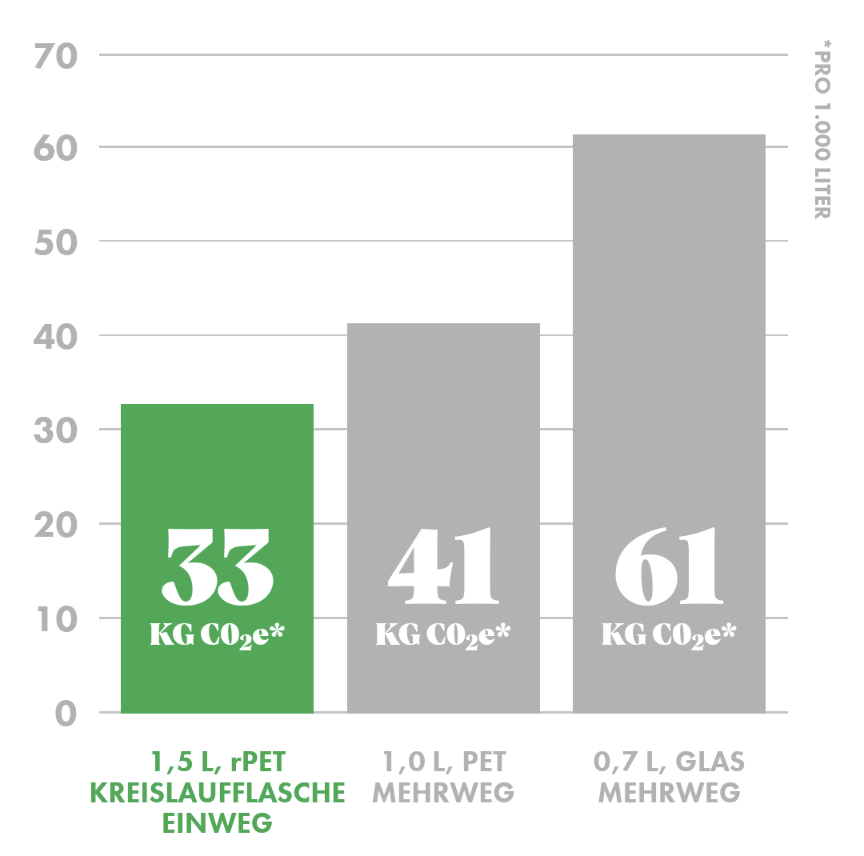
The bar chart shows that their bottle produces less CO2 per 1000 Liters than reusable plastic and glass bottles. However, they have employed some tricks to ensure that the Data fits the story.
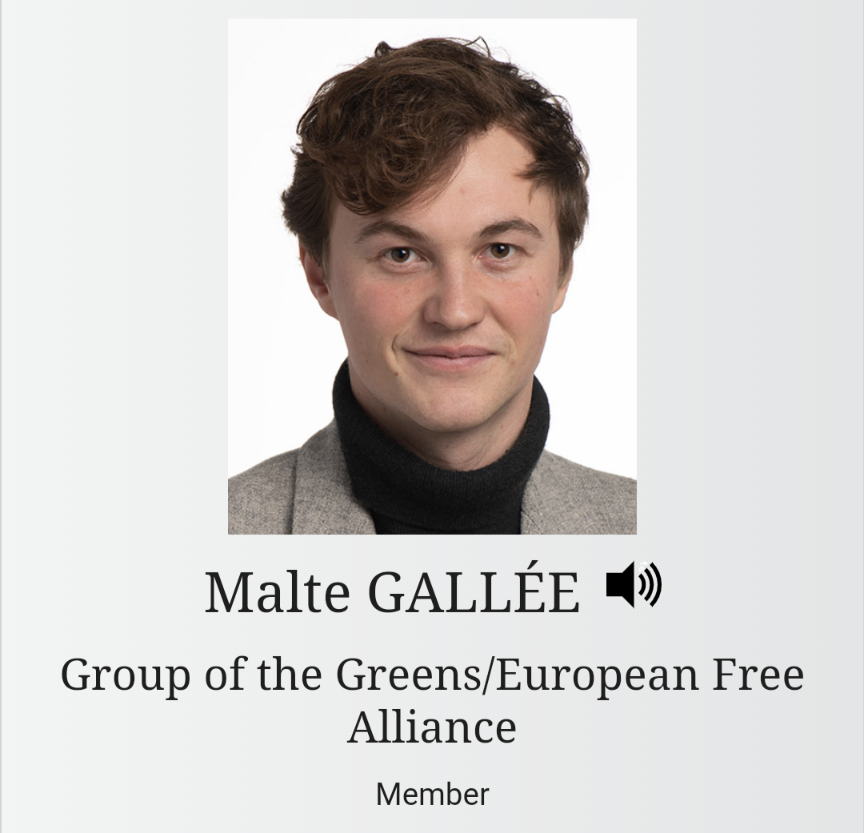
Malte Gallé, a member of the European parliaments, has uncovered several techniques of manipulation.
- The comparison is between bottles of different sizes. The Lidl bottle measures 1,5 litres, while the other bottles are smaller: 1 L and 0.75 L
- The Data compares only the Lidl brand disposable plastic bottle: not disposable plastic bottles in general.
- The Data shown here is from 2008. Since then, the reusable bottle pooling systems have evolved to be more efficient and ecological.
Without meaning to they are teaching us a few tricks on how to lie with Data: compare slightly different entities with each other, compare something specialized with something general and last use old Data if it gives you an advantage.
I call this Dark Data Design, after Dark UX design. Dark Design is used to trick users into clicking something they do not intend to click. The Data in this example is not manipulated, it is how the Datapoints are chosen and combined that is manipulative.
Sources: https://youtu.be/5Rv0eQ5Gi2U www.diekreislaufflasche.de https://vm.tiktok.com/ZGJu98ukc/