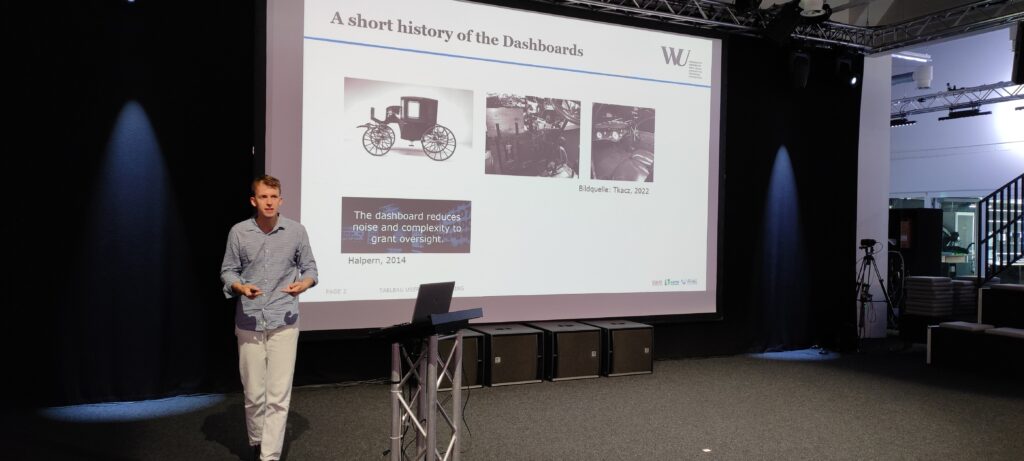
Guestauthor Felix Diefenhardt of the Wirtschaftsuniversität Wien is working on his PhD about Dashboards and their users. He first presented on this topic on a TUG Munich meeting. He is currently looking for interview partners. If you would like to support research, be sure to contact him. His information can be found on the bottom of the page.
Living in Vienna, I am constantly surrounded by dashboards. I see them at work on my laptop, in
various apps on my phone screen, but also as I stroll through our historic city center. There, tourists
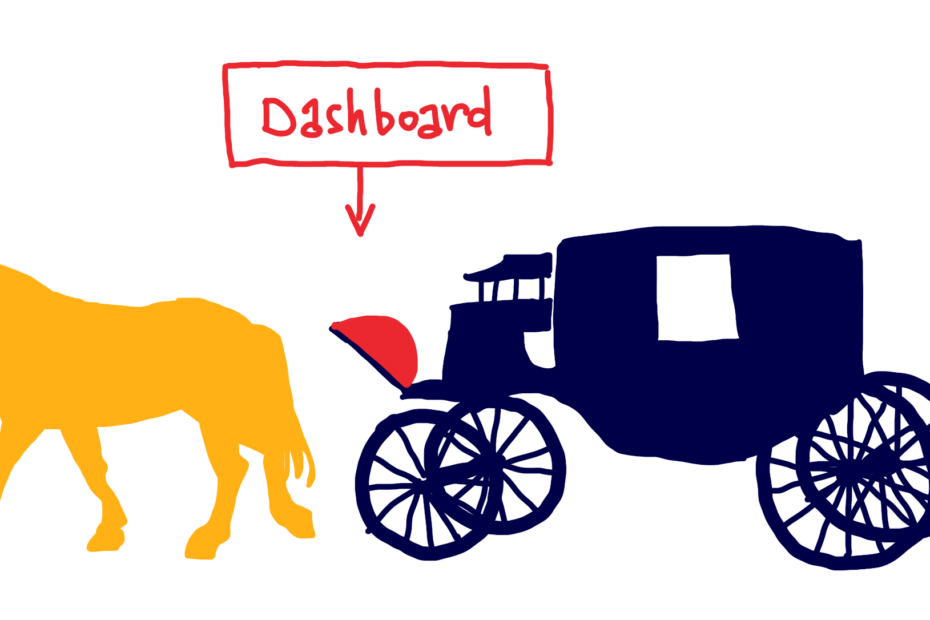
are chauffeured around in traditional horse-drawn carriages called Vieracker. These carriages have
been roaming the streets of Vienna since the 17th century, and since then they have carried the first
ever dashboard. The dashboard is a wooden board placed directly in front of the coachman or
coachwoman to prevent the horses’ hooves from scraping the mud from the streets into the interior
of the carriage. This in turn allows drivers to concentrate on their task.
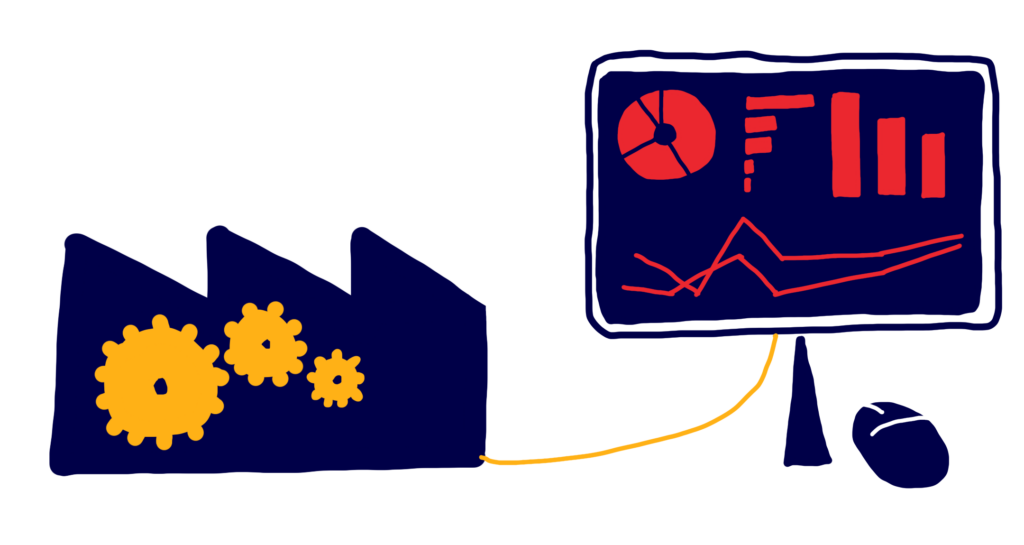
So, for those of you wondering what the interfaces that consolidate various data visualizations have
to do with dashing, here is the answer. But this is more than a curious historical anecdote. In order to
understand how media technologies format our perception and what kind of pitfalls they may entail,
it is often helpful to look at the historical development of these media.
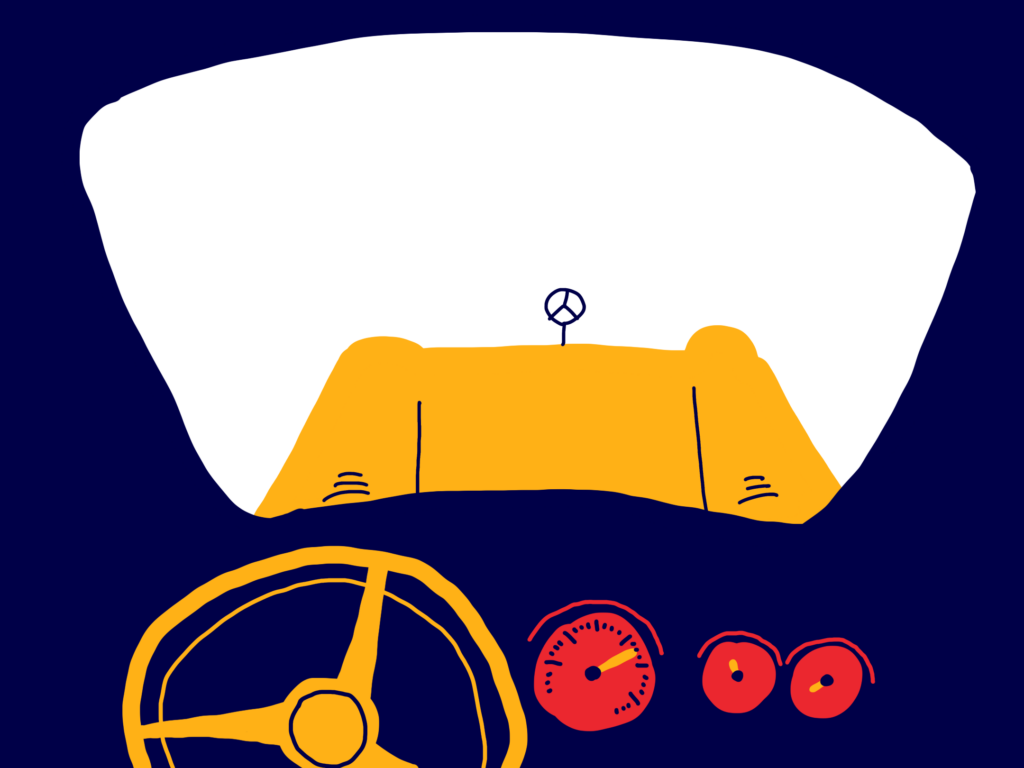
As we can see, the very first dashboard in some ways performs the central functions of our modern dashboards. It reduces complexity and filters out distracting bits of the carriage environment (the literal mud) to enable humans fulfil a task that demands their attention and oversight (driving the carriage). Similarly, today we look at dashboards to filter out useless information, statistical noise, unclean data (the proverbial mud) to enable us to make certain decisions. But this already points to a certain bias of dashboards: They tend to provide very clean and simple portraits of a more complex reality. For their users, it is important not to confuse the map with the territory, and sometimes to be willing to step into the (literal and proverbial) mud to get the qualitative information filtered out by the dashboard. However, as the further evolution of the dashboard shows, the more complex and dynamic our environments and technologies become the more humans need to rely on the reduced complexity of the dashboard. As horses were replaced by engines, the dashboard became an interface through which drivers could access the machine that kept them moving. Initially, this was done, for example, by dipping a stick into the fuel tank to see when a refill was needed. As new measuring devices were developed and cars accelerated, the constant manual engagement and monitoring of the engine was no longer necessary or possible. The dashboard now became the graphical user interface we know today, giving the driver all the information he needs at a glance, because at the speed of modern cars, a glance at the dashboard is all the driver can manage.
As with most graphical user interfaces, this has two effects: On the one hand, it allows more people
to drive by eliminating the need for the technical skills required by earlier automobiles. On the other
hand, the driver now controls a machine of which he has little knowledge. The more intuitive the
interface, the more mysterious the technical operations behind it. The same paradox applies to
today’s digital dashboards: Everyone in a leadership role, from executives to middle managers, wants
a dashboard – the front end. But most don’t want anything to do with the backend. What may be
annoying to those working on the backend can also be a serious risk. If decision makers are
unfamiliar with potential biases in the data, the quality of their data, the statistical models used, or
the simple fact that correlation is not causation, the intuitive look and feel of the dashboard can
hinder rather than enable qualified decision making.
Thus, our brief review of the historical evolution of dashboards shows that they not only reveal
information and enable decisions, but also hide complexities that are considered unhelpful to those
decisions. This means that a mindful use of the dashboard requires us to get down in the mud from
time to time and get comfortable with the backend of the dashboard. Two lessons every good driver
must learn.
Felix Diefenhardt, Interdisciplinary Institute for Management and Organisational Behavior. Vienna University of Economics and Business.
Do you want to support his research? You can contact him via LinkedIn, Email or Telephone: Tel: +43-1-313 36-5176 E-Mail: felix.diefenhardt@wu.ac.at
More on the development of dashboards and various set ups throughout the last decades can be found in the article linked below, that is also inspiration and source to Felix’ work: