I enjoy exchanging information and experiences. I have organized and moderated round tables and info-talks and I regularly present at Tableau User Groups about Dataviz related topics. As a women in Tech and career changer into Tech I passionately try to forward both.
If you are looking for a speaker for your event, feel free to contact me.
- DIY Dataviz – a Workshop
 Workshop – Truth and Beauty Operator Moritz Stefaner and me created a Dataviz Workshop without any technical equipment. What happens if you ask the participants of your workshop about which pasta they like best – and then you give them pasta and hot glue and ask them to built a graph from this? Our goal… Read More »DIY Dataviz – a Workshop
 - Evelyn Münster, the Chart Doktor
 Podcast/ online Event – Data+Women Lunch series is a new format, that Heidi and me are trying out. We want to provide a platform for Women* in Data to present their topics, and to invite anyone (it’s not Data MINUS men, everyone is invited) to be informed and entertained during lunchtime. Sign up for our… Read More »Evelyn Münster, the Chart Doktor
 - AI took my job – now I am their supervisor
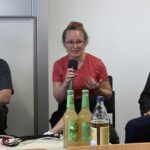 Panel Discussion – INFORMATIK 23 Berlin I was invited on the panel about AI and job security at the INFORMATIK 23 conference in Berlin by the Gesellschaft für Informatik. I was the only one with a background in business, my fellow panelists were from politics, research and education. Interestingly enough the question how we will… Read More »AI took my job – now I am their supervisor
 - Power Lunch: All about Tableau
 Event – Tableau for beginners: 60 Minutes Deep Dive with Women In Tech e.V. My audience was curious: I had some freelancers who considered taking on Salesforce Projects in the audience. They were excited to look at Tableau, because it is one of the tools that live within the Salesforce Universe. In one hour I… Read More »Power Lunch: All about Tableau
 - Talks for TUGs
 Talks – Besides leading myown Tableau User Group I enjoy speaking at TUGs all over. From the HealthcareTUG to Vienna TUG, from Florida TUG to Data+Women. If you would like me tospeak at your TUG, feel free to pick a topic or suggest a new one. DynamicZone Invisibility: how to improve your dashboard UX (Florida… Read More »Talks for TUGs
 - Unf*ck your Data – Tableau community edition
 Podcast – What is special about the Tableau Community? Unf*ck your data is format that covers all kind of data topics: I was happy to speak about the Tableau User Group and Tableau Community. Christian Krug, the host, was really interested in why this community is so special and unique. You can listen to the… Read More »Unf*ck your Data – Tableau community edition
 - VizIt Berlin Speaker Announcement
 Talk – Community in-person event in Berlin, November 13-14th Register for this free event here: VizIt Berlin 2023 (interworks.com) I have been accepted with two session at the VizIt Berlin ’23 – a great opportunity to share my passion, give back to the community that gave me so much and to inspire others. The first… Read More »VizIt Berlin Speaker Announcement
 - Dynamic Zone Invisibility Florida TUG
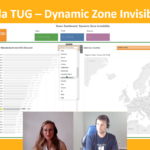 Tableau User Group – In 2022.3 a new feature stirs up the Tableau COmmunity: showing and hiding dashboard objects (yes, plural) based on a parameter Value. THis features opens new possibilities to individualize and improve your Tableau Dashboard. In This Input I talk about the most impressive Use Cases for me and show how it… Read More »Dynamic Zone Invisibility Florida TUG
 - Mehr Frauen in IT Berufe – wie kann das gelingen?
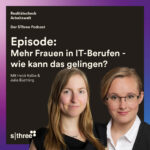 Podcast – Sthree Realitätscheck Arbeitswelt hat meine Kollegin Heidi Kalbe und mich eingeladen über unsere Erfahrungen und Meinungen zu Frauen in der IT zu sprechen. Hier gehts zu der Podcast Episode in allen gängigen Portalen:
 - The Tableauverse: Tableau Desktop and Tableau Server
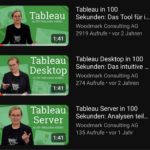 Video – Which Tableau Products are there and how do they interact to provide one of the most popular and impactful analytical platforms of the hour? Because words are too black and white I created three informative and animated videos that give you a quick and thorough understanding of what to expect and how to… Read More »The Tableauverse: Tableau Desktop and Tableau Server
 - Workshop @solutions:hamburg
 Workshop with Moritz Stefaner (truth and beauty) Does aesthetic have a function in Dataviz? Or is it just secondary, is it enough if the Visuals are right without any aesthetic appeal? Join us in exploring this questions: Moritz Stefaner and I team up at the solutions conference in Hamburg, an event all about digital transformation.… Read More »Workshop @solutions:hamburg
 - 8th TUG Munich Meeting – server logs
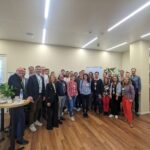 event recap – Using Tableau Server Logs to track if users are using the dashboard they are supposed to. The 8th in person meeting room place on April 25th at Salesforce Munich. Keynote speaker was Rudolf Hattenkofer from sell & pick. The company is a IT service provider in the food industry. They provide standard… Read More »8th TUG Munich Meeting – server logs
 - #SpeakUp mit Regina von Women in Tech e.V.
 Interview –
 - 02.03.23 Tableau in 100 Minutes
 Workshop – I again team up with Junge Gesellschaft für Informatik and offer a workshop and insights into using Tableau. For students and anybody that is interested. Be ready to click along!
 - 28.02.23 Dataviz Meetup @ Celonis
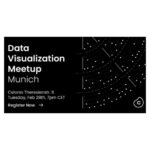 In-Person Event – 16th Dataviz Meetup Munich at Celonis Headquarter! Organized by Mihael Ankerst, Phillip Koytek and me, we will meet at 19:00h at Celonis Headquarter. I will contribute a session about Tableau vs Power BI from different perspectives. Our tentative Event Schedule: 7:00 – 7:30 PM: Come together + drinks/food + chats 7:30 –… Read More »28.02.23 Dataviz Meetup @ Celonis
 - 5 Seconds Difference: Dataviz vs. Excel (GER)
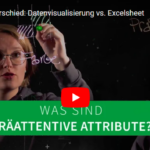 Explanatory Video – Did you know that your brain knows the meaning of this ⬆ much more quickly than reading the word “up”? In this lies the entire reason for Dataviz: looking 👀 is quicker than reading 📚. Check out this video explaining all about how to encode data through pre-attentive attributes. Woodmark Consulting AG… Read More »5 Seconds Difference: Dataviz vs. Excel (GER)
 - Jobs in IT that will surprise you
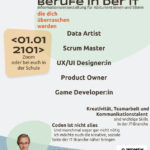 Talk – Dear student-Me, Tech jobs can be creative and communicate. They often center around people, not code. When you decide on your future, consider these jobs in Tech and do not from the start turn a blind eye on an entire industry that has so much to offer of what is important to you.… Read More »Jobs in IT that will surprise you
 - 5 Layout Tips for BI-Dashboards
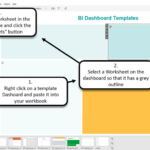 Good Read – What can modern dashboard developers learn from Michelangelo to build better dashboards? Learn more about my five Layout Tips for Dashboards in this Blog article, published in the Woodmark Consulting Blog Also there are some free dashboard templates for Tabeau, published on my Tableau Public Page:
 - Roundtable von bitkom: Quereinstieg in die IT 14.02.22
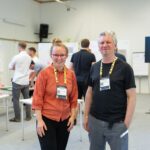
 Remote Event – Eine Kanzlerin, eine Trainerin von AWS und ich, eine waschechte Quereinsteigerin (so wurde ich vorgestellt), haben hoffentlich das Thema Quereinstieg in neue, neugierige Köpfe gepflanzt. Die Veranstaltung wurde organisiert von der bitkom Initiative #shetransformsIT, der Roundtable fand Mittags statt und wurde nicht aufgezeichnet. Das Event hat mich zu meinem eigenen Infoevent “Karrierewechsel:… Read More »Roundtable von bitkom: Quereinstieg in die IT 14.02.22
 - Mehr Frauen auf die Bühne! Speakerinnen.orgNetworking – Viele Menschen stört, dass Männer viel häufiger als Experten zu Konferenzen eingeladen oder von den Medien befragt werden. Biologisch gibt es dafür keinen Grund: Männer sind nicht klüger als Frauen. Wer Organisator*innen auf die Diskrepanz hinweist, bekommt oft die Reaktion, dass keine geeignete Frau zu finden war. Wir sind davon überzeugt, dass es… Read More »Mehr Frauen auf die Bühne! Speakerinnen.org
- FRIDA: Mehr Kreative in die Techbranche!
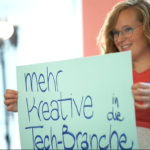 Networking – Ein Projekt, um junge Frauen in der digitalen Arbeitswelt sichtbarer zu machen und Vorbilder zu sein: find ich richtig gut. Dabei stehe ich voll dafür, dass wir mehr kreative Menschen in der Tech Branche wollen und damit besonders die Mädchen ansprechen, die gar nicht wissen dass es sowas gibt. Wir sind FRIDA Wir… Read More »FRIDA: Mehr Kreative in die Techbranche!
 - 08.03.22 Tableau Buddy User Group: From building sculptures to building dashboards
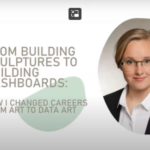 Remote Event – How did I end up in Tech, when I used to be an artist? This is my journey from Artist to Data Artist, the hurdles and highs I have had since changing careers in 2019. Watch from minutes 25 for my talk.
 - 16.12.22 Data+Women Christmas Special: From Art to Data Art
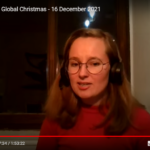 Remote Event – Happy to share my story how I changed careers from Art to Data Art.
 - 19.07.22 Hetug: Hacks with invisible Shapes
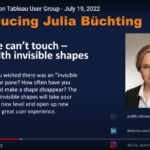 Remote Event – Everybody knows Shapes in Tableau, but did you know you can add an invisible shape and just trick the system a bit? I have published the resources for this click-along-workshop on my Tableau Public Page. Tune in at minute 25 for my Talk.
 - 27.09.22 Level Up II: UX in everyday life into BI dashboards
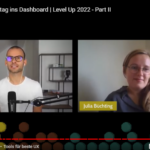 Remote Event – How can we use everyday UX in our dashboards to make them more user friendly, easy to use and quick to understand? As past of Level Up II by Reporting Impulse I was invited to talk about my pet peeve: UX.
 - BI or DIE: get to know
 Conversation –